Breaking Ground
On the San Andreas Fault, a team of geologists has found evidence of powerful earthquakes from farther back in time than ever before. But as Sean Cummings reports, California’s deep seismic history remains difficult to pin down. Illustrations by Lindsay Newey and Kaelin O’hare.
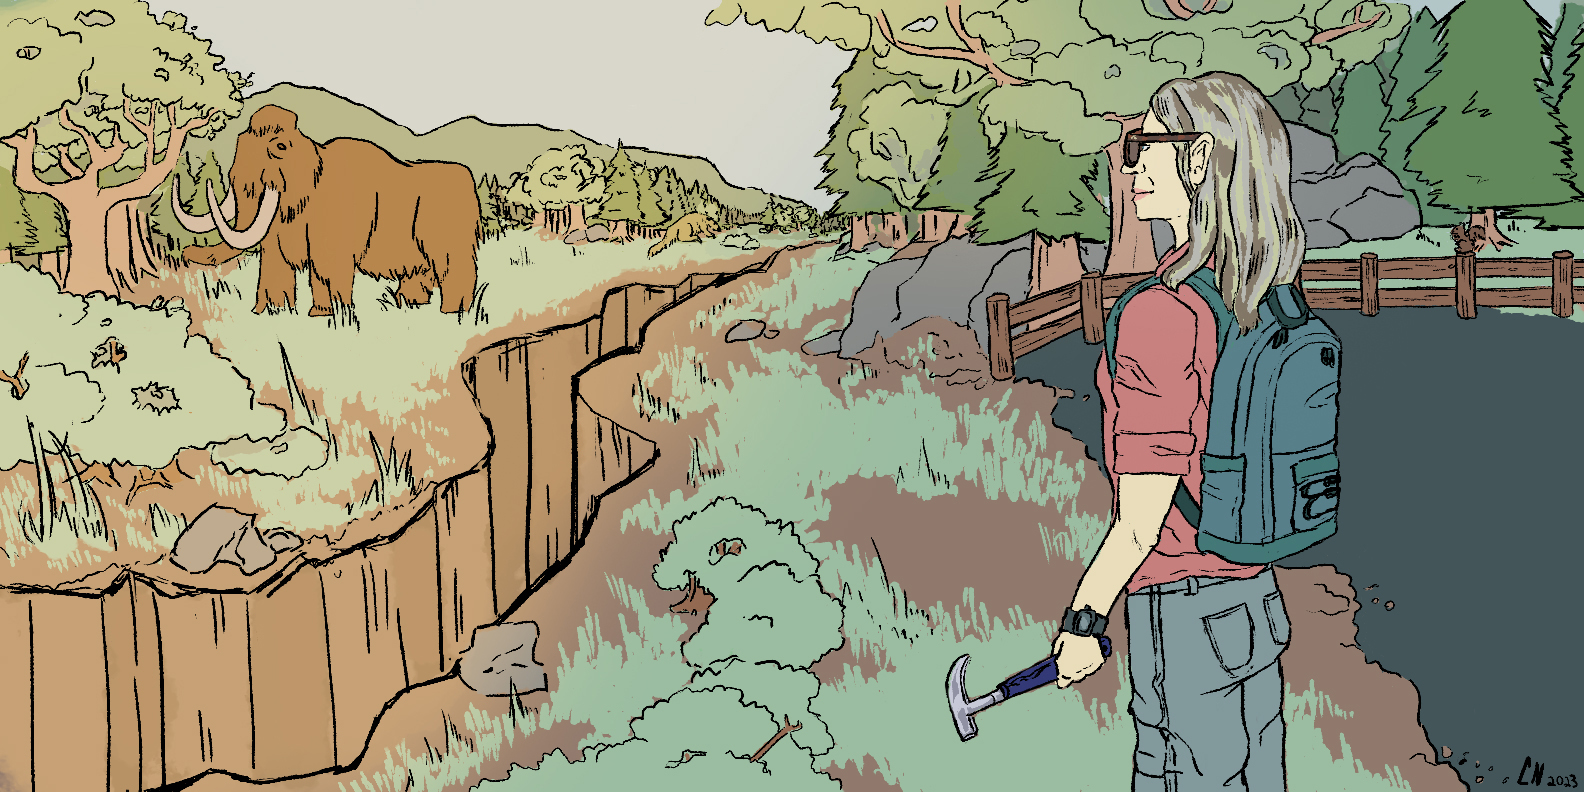
Illustration: Lindsay Newey
From a roadside outcrop, Heather Savage pries loose a fist-sized rock the color of dirty snow and presents it to the four students standing before her.
She’s brought them to this spot just northwest of San Juan Bautista, California, to observe rocks on the San Andreas Fault, the state’s most famous seismic system. On the drive over they saw distorted foothills, warped where the fault had tugged their bases north from their peaks; sunlit water flashed where disturbed earth had sunken to form a pond. Storm runoff had split the unpaved country road with foot-deep fissures, forcing Savage’s Prius to jostle and weave around miniatures of the massive earthquake rifts Hollywood teaches us to imagine.
“It’s getting better. Just another 2.8 miles on this,” Savage laughed. Then, quieter: “Should I turn around? Is this dumb?”
After all that, the unassuming clod in Savage’s hand makes a poor climax to the untrained eye. It crumbles like dry cheese under a few taps of her hammer.
But to Savage, an associate professor of Earth and planetary sciences at UC Santa Cruz, that crumbliness is the climax. A major earthquake — perhaps the massive 1906 quake centered just off the coast of San Francisco — might have pulverized this rock, she tells the students.
If geology means piecing together the (literally) groundbreaking events of Earth’s past using clues entirely unspectacular to the unaided senses, this case only scratches the surface of what the San Andreas has to offer: a deeper history mystery lies just down the faultline. Savage has spent a decade digging into the possibility that, not too far south of this spot, quakes rivaling the 1906 event might have been crushing rocks to bits like this millions of years ago.
If so, it could challenge conventional understandings of California’s seismic past. The San Andreas has hosted some of the strongest earthquakes in the state’s history — but as far as geologists know, no major quake has ever originated along the section of the fault running south from San Juan Bautista.
Now, however, Savage and a team of geologists from UC Santa Cruz and Columbia’s Lamont-Doherty Earth Observatory have used rocks from that section of the San Andreas to test a technique that lets them detect earthquakes much farther back in time than current methods allow. If it holds up, the technique may reveal cycles of major earthquakes in places previously unknown, occurring on timescales longer and slower than geologists have ever measured.
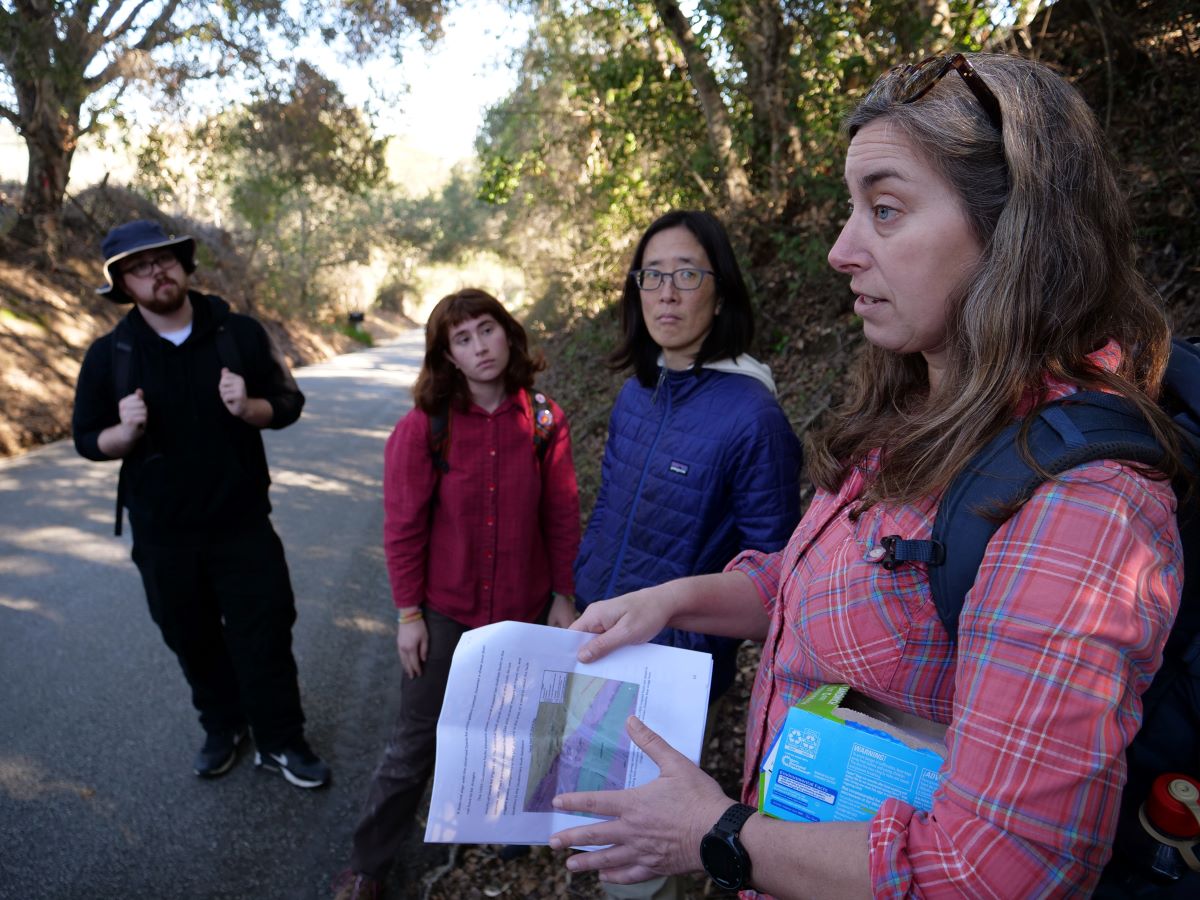
From a roadside outcrop near where the San Andreas Fault runs through San Juan Bautista, CA, Heather Savage discusses the fault’s geology with her students. Photo by Sean Cummings.
The Rumblings of a New Idea
Geologists have three main ways to peel back the history of seismicity, or earthquake activity, along faults like the San Andreas.
The first, known as the seismic record, includes every earthquake measured with modern instruments at the times those quakes actually occurred. This record offers high accuracy but only goes a few hundred years back.
The second, the historical record, reaches back before the invention of seismometers, drawing on written and oral accounts from indigenous peoples and colonial settlers.
Finally, the paleoseismic record goes back further still, analyzing disrupted layers of rock from deep within fault zones using methods like carbon-dating. But even that only takes us back a few tens of thousand years at most — still just a blink of the eye in geologic time.
“It’s really important for us to think about what could have happened before the records that we have now. The historical record, the paleoseismic record, the indigenous records — what else can we use?”
“It’s really important for us to think about what could have happened before the records that we have now,” says Wendy Bohon, a geologist and Strategic Communications Specialist for the Earth Sciences Division at NASA Goddard. “The historical record, the paleoseismic record, the indigenous records — what else can we use?”
In 2005, Savage found the first hint of an answer.
Over dinner one night, she listened as Pratigya Polissar, her colleague and husband, complained about some rocks he’d gotten from the Tibetan Plateau. As a paleoclimatologist, Polissar was studying the rocks’ molecular makeup to reveal clues about what types of organisms lived on the Plateau millions of years ago, when those rocks first formed.
But Polissar still had to find out whether the molecules would talk. If an underground heat source had cooked them, he complained, it could have scrambled their elements and erased the signatures of life he was looking for. In that case, instead of a snapshot of prehistoric creatures, Polissar would find only a molecular burn mark.
That gave Savage an idea.
“Wait, do you know how to tell if a rock has experienced heat?” she asked.
During an earthquake, she knew, friction between rocks could raise their temperatures hundreds of degrees. If heat could leave a molecular mark on rocks as old as Polissar’s, Savage thought, then it might also reveal earthquakes equally as old — letting her study the seismic histories of fault systems farther back in time than ever before.
The pair realized they might have the beginnings of a new way to read the seismic record — but they needed to test it. Savage would have taken rocks from any fault zone to do so, she says. But when samples from the San Andreas became available for study, she saw a chance to not just test her new technique but to probe some tectonic mysteries.
A Window Through Time, Burned Into Stone
If you’ve lived in California, you’ve probably heard of the San Andreas Fault and the massively destructive earthquakes it has hosted.
Earth’s tectonic plates, the puzzle-piece segments of the planet’s crust, constantly slide against, under, and over each other at imperceptibly slow speeds. The San Andreas occurs where the Pacific plate grinds against the North American for 800 miles up and down California, with the former drifting north and the latter pushing south. The plates move in parallel, rubbing along their edges: ⬆️⬇️.
In the northern and southern sections of the San Andreas, Savage explains, friction between the Pacific and North American plates prevents them from sliding like they want to, locking them into place as they try to move. Eventually, enough tension builds that the plates lurch past each other.
These violent slips can have deadly ends. The 1994 Northridge quake near Los Angeles and the 1989 Loma Prieta quake near Santa Cruz each killed over 60 people. Combined, they dealt over $26 billion in physical damages, with the latter toppling the upper deck of the San Francisco-Oakland Bay Bridge. The 1906 quake in San Francisco dwarfed both: with help from the fires it sparked, it killed 3,000 people and razed over 28,000 buildings.
But the central section of the fault between Parkfield and San Juan Bautista — where Savage took her students on the field trip — behaves differently. Here, the plates slide along more or less freely, preventing the buildup of tension that creates massive quakes. Geologists call this behavior “aseismic creep.”
All historic quakes of magnitude 6 or higher within or near California in the US Geological Survey earthquake catalog, with the San Andreas Fault shown as a dotted line and circle size corresponding to amount of ground shaking recorded. While the central San Andreas is more likely to experience frequent, smaller quakes due to its constant “creeping” behavior, the largest quakes have all occurred in the northern and southern sections.
“One of the things that we don’t really understand about [the] creeping section is ‘Has that section of the fault always crept? Could it have big earthquakes if you tried to make it?’” says Savage.
In 2013, she and Polissar secured grant funding to study rocks drilled from the fault in Parkfield, near the creeping section’s southern end. Searching for molecular signs of superheating far into the past, they hoped, would let them investigate whether any major quakes had ever happened there.
Under extreme heat, some molecules transform into new ones. Others flip the orientation of their atoms, rearranging their structure into a mirror image of themselves. Borrowing techniques from Polissar’s paleoclimatology research, the team ran tiny quantities of the Parkfield rocks through a series of machines to pick out these mixed-up molecules, or “biomarkers.” Depending on how many were present, and in what proportions, they could tell how hot each rock sample got. Detect enough heat, and you may have found evidence of an ancient earthquake.
But earthquakes aren’t the only source of underground heat. If you expose a rock to a lower but longer-lasting heat source, for instance, it could leave the same signature as a quick, superhot event like an earthquake. Savage compares this to toasting bread: a slice left on low heat for five minutes might look the same as one toasted at high heat for one minute. How can you tell which is which?
To answer, Savage points out that the biomarkers only occupy tiny areas of rock measuring a few millimeters across. A long, low pulse of heat, she says, would look different. A flow of hot underground fluids, for example, would have pierced the rock with a pattern of mineral veins over a broader area. A rapid event like an earthquake, meanwhile, could leave more tightly concentrated scars like those Savage observed.
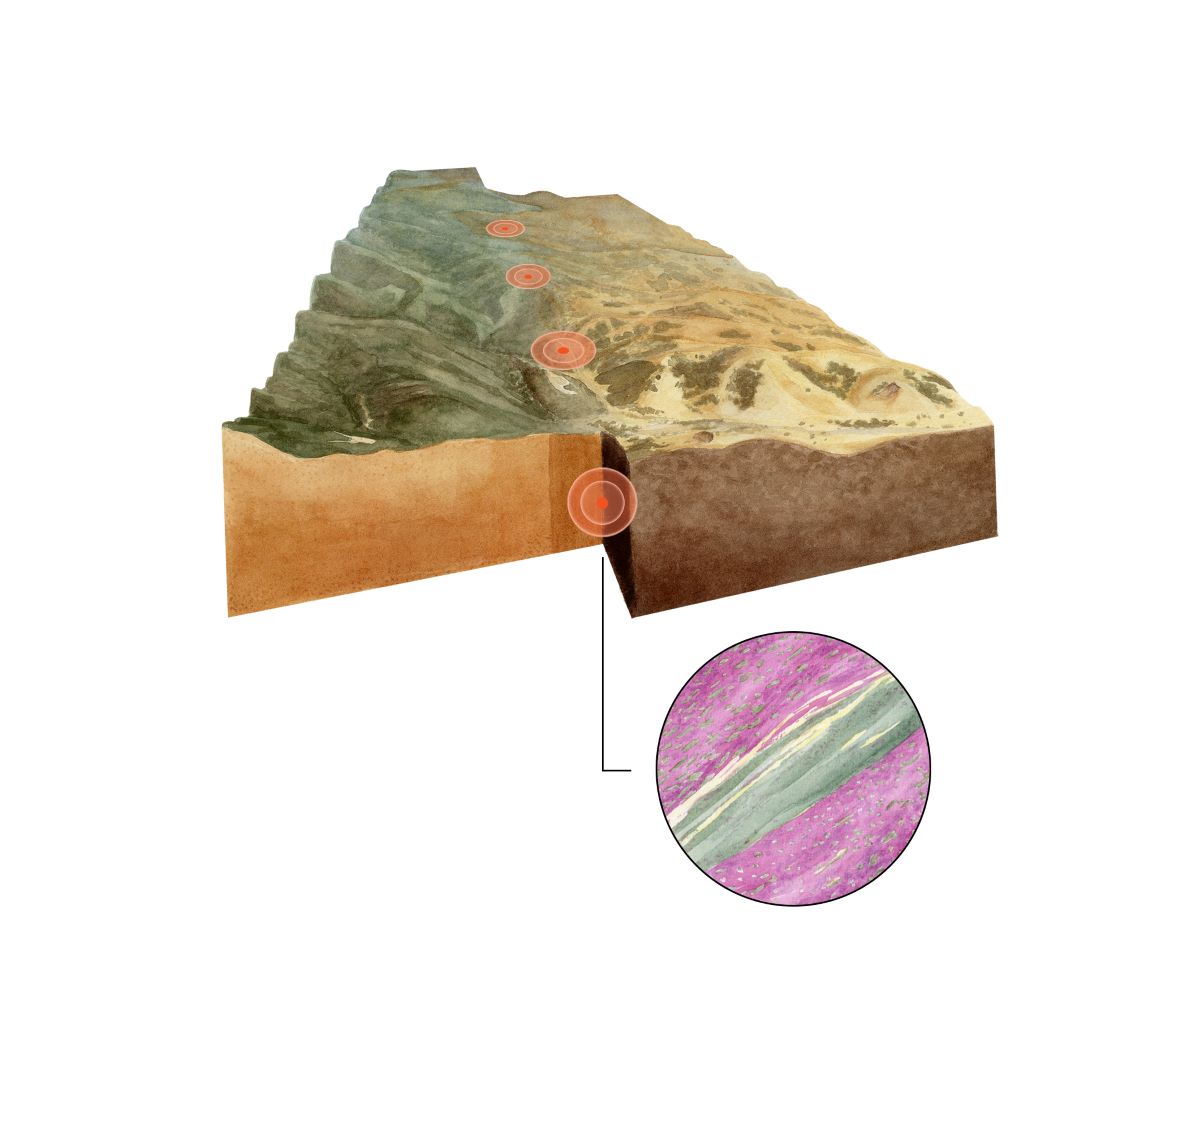
Powerful earthquakes along the San Andreas Fault can leave numerous “biomarkers” — tiny areas where friction heats a few millimeters of rock enough to scramble their molecules and force argon out of their bodies. Artwork by Kaelin O’hare.
The mixed-up molecules in those scars could reveal whether earthquakes had occurred, but not when — a crucial piece of information for determining how frequently quakes strike. For that, Savage turned to Stephen Cox, an associate research scientist at the Lamont-Doherty Earth Observatory at Columbia University.
Cox used a method called potassium-argon dating. Since potassium decays into argon, the ratio between the two elements in a rock gradually tips toward argon over time. This provides a timestamp of the rock’s age: the more argon relative to potassium, the older the rock.
Extreme heat, however — like that from an earthquake — can force argon out of a rock, resetting the rock’s elemental “clock.” From this point forward, instead of telling the rock’s age, the potassium-argon ratio hints at how long ago the superhot disturbance likely occurred.
Because of this, Cox could use the ratios of potassium to argon in the Parkfield samples to estimate dates for the major earthquakes Savage and Polissar had detected. Based on his measurements, the most recent had struck no earlier than 3.2 million years ago — an enormous leap back in time from even the oldest quakes in the paleoseismic record, each a few thousand years in the past.
With this final gap filled, the team published their results in Geology in February 2022 — 17 years after Savage and Polissar first conceived of a way to push the earthquake record farther back than ever before.
Overall, the team had found likely evidence of over a hundred earthquakes in the Parkfield rocks. Based on the degree of heating and the rocks’ physical properties, the team estimated an average slip distance for those quakes indicating a magnitude of at least 6.9 — equivalent to the Loma Prieta event that rattled the Santa Cruz mountains in 1989.
A Seismic Domino Chain
There was just one problem: as far as geologists can tell, there’s no way an earthquake that big could ever originate in Parkfield. Because of its creeping behavior, the San Andreas Fault’s central section doesn’t store enough tension to create such high-magnitude events — at least, not on its own.
One way a 6.9 earthquake could have occurred there, the team reasoned, is that an earthquake somewhere else had enough power to ripple along the fault as far as Parkfield, pushing the central section as well — like one domino toppling another.
“If you had an earthquake starting in the southern or northern section, and that’s already got a bunch of energy, it can basically kick into the central section,” says Genevieve Coffey, a paleoseismologist at GNS Science in New Zealand and lead author on the study in Geology. “It’s already big enough; it’s gonna keep going through.”
A massive enough earthquake might not settle for hitting just two sections of the San Andreas, Coffey goes on — it might even rip through all three. A quake originating near Los Angeles and rippling north up the fault, for instance, might charge right through Parkfield and continue onward as far as the Bay Area or beyond. The resulting “whole-fault rupture,” the team reported in the Geology study, could reach higher than magnitude 8.
The 1906 quake that rocked San Francisco and killed 3,000 people was a 7.9. Since earthquake magnitudes are measured on a logarithmic scale, a magnitude 8 event would be over 40% stronger.
Bohon, the NASA Goddard geologist, says a quake like this could cause major damage to freeways, train lines, power lines, aqueducts and fiber-optic cables that crisscross the fault. And those are just the direct impacts. San Francisco’s 1906 earthquake caused major damage in its own right — but the fires it triggered devastated the city even further.
“Now we’re in a situation where gas lines have broken. There’s gas leaking, people are trying to cook outside [instead], so you start fires. And the water pipes are also broken, so now you don’t have any water to fight those fires,” says Bohon, who was not involved in the study. “There’s this potential for cascading hazards.”
Ancient to a Fault
But Bohon feels skeptical about whether Savage and Polissar’s work tells us anything about the odds of a disaster like this striking in the future — especially in the central section.
She points to uncertainties in the study about how the rocks involved would physically behave during a slip: though the team’s models suggest most of their earthquakes would have caused a 1.5-meter slip on average, for instance, the possible range for each quake’s slip runs as low as 0.5 meters. That would correspond with the smaller quakes already common to the region.
And even assuming most of those quakes had high magnitudes, Bohon says, their ancient ages — the very thing that makes Savage and Polissar’s methods so potentially groundbreaking — means they may have little to no bearing on how we think about earthquake risks today.
Bohon is not the first geologist to raise this point.
“My main issue is simply that they are looking at old rocks (3.2 million years ago and older!) so it doesn’t necessarily tell us about what is going on now,” wrote Katherine Scharer, a research geologist with the USGS Earthquake Hazards Program in Pasadena, CA who was not involved in the study, in an email.
“The plate tectonic configuration was pretty different three million years ago,” says Devin McPhillips, another research geologist with the Earthquake Hazards Program not involved in the study. “The rocks that they’re looking at were far away from where they are now.”
The rocks Savage’s team analyzed came from the Pacific plate, which drifts north along the San Andreas Fault. A 3.2-million-year-old quake, the argument goes, would have struck back when those rocks still sat in the fault’s locked southern section, where massive quakes are common anyway. If so, it would mean the team’s findings reveal nothing new about how the central, creeping section behaves.
While Savage understands these concerns, she feels they overlook a key point. Rocks in the fault zone don’t always move consistently in one direction, she explains. Her samples could have easily caught on the North American plate and moved south for a while, then ridden north with the Pacific plate at other times — potentially bouncing back and forth within the central section for millions of years. To Savage, this means the major central-section quakes her study describes remain entirely possible, if not guaranteed.
Her team has also continued to refine their potassium-argon technique, hoping to narrow down the possible date range for the prehistoric earthquakes they discovered in the Parkfield rocks. When estimating ages for those quakes, the team originally assumed the quakes had forced out all of the rocks’ argon, fully resetting the rocks’ potassium-argon ratios so as to closely reflect the quakes’ ages. But some quakes, Savage says, might have only driven out some argon, leaving the rest behind. Because more argon generally means “older,” those leftovers would make the quake’s potassium-argon timestamp appear inaccurately old.
As a result, Savage and Coffey expect their quakes will turn out younger than the maximum ages they originally estimated. Indeed, the team’s most recent work now suggests one quake may be less than a million years old. And Savage expects the estimates to keep trending younger — making it highly likely, she says, that some of her earthquakes really did happen in the San Andreas’s central section, rather than down in its southern section.
Bohon still thinks hazard planners should focus on preparing for more frequent, moderate quakes before spending time and money worrying over major events that might come only once in a million or more years.
But she acknowledges the value of knowing the upper bounds of what’s possible. Any evidence that a major central-section quake — or a whole-fault slip — could even be possible, she says, means we should keep studying that possibility. If we don’t, we risk losing a piece in the puzzle of how faults behave over geologic time, limiting our understanding of seismic hazards.
The team’s research beyond the San Andreas Fault supports that notion. In addition to the samples from Parkfield, Savage and Polissar had a chance to try their biomarker technique on rocks from the Tohoku-Oki fault zone as well — the fault that caused Japan’s devastating magnitude-9 earthquake and tsunami in 2011.
Before then, Polissar says, geologists hadn’t expected such a massive quake in that particular region of the fault zone — no precedent for it existed in the historic record. But in a study published in Nature Communications in 2020, he and Savage used their technique to reveal a history of powerful earthquakes too ancient for conventional paleoseismic methods to detect.
“What we were able to show in the sediment core is that many, many large earthquakes occurred there,” Polissar says. In geologic time, “the tsunami that occurred in 2011 was not unique for that part of the subduction zone.”
The team hopes to continue using its technique to study the seismic histories of faults around the globe. Coffey and Cox, for instance, have started to gather rock samples from the Whakataki fault in New Zealand. The goal is the same: search for evidence of quakes farther back in time than ever before.
No amount of evidence will magically prevent earthquakes, of course. But refining our sense of what disasters lie within the realm of possibility, the team hopes, could at least give people living near fault zones the information to prepare for the rarest, worst-case scenarios.
Earth: A Mystery Novel (Pages Not Included)
We may never, however, understand the entirety of what fault zones can do.
“It’s just cool to think about. This 4.5-billion-year-long experiment that the earth is running, and we can’t see its lab notebook.”
Back at the roadside outcrop near San Juan Bautista, Savage zips the crumbly white rock up in a plastic bag. As the group ambles back towards the cars, a student named Julia recalls a memory from her introductory geology course. On the first day of class, Julia says, her professor held up a book titled “The History of the Earth” and ripped it to shreds with her bare hands, leaving only a few tattered pages. This is what we’ve got to work with, the professor told the class. It’s the only science where the experiment already happened and we’re just left to pick up the pieces.
“It’s just cool to think about,” Julia says, smiling. “This 4.5-billion-year-long experiment that the earth is running, and we can’t see its lab notebook.”
She turns to Savage. “You like mystery novels, right?”
Savage grins. “That’s, like, all I like.”
© 2023 Sean Cummings / UC Santa Cruz Science Communication Program
Sean Cummings
Author
B.A. (environmental humanities) Whitman College
Internships: Good Times and KQED Deep Look
Age six marked my anglerfish phase. I read about them nonstop. I dressed as one for Halloween. But I found no fellow fanatics—until I sat for a presentation on deep-sea fishes at the Monterey Bay Aquarium.
The speaker showed a picture of an anglerfish, and when he noted the glowing stalk on her forehead, I gushed. “It’s to lure prey in darkness! Only females have those! And…” I’d interrupted, but he let me rave awhile before addressing the audience, chuckling: “Yes! What that kid said!”
I’d meant to nerd out with him alone, but his response showed me I could do more. With enthusiasm and a straightforward vocabulary—and, sometimes, a willingness to disrupt—I could reach entire audiences. I keep that lesson close today as I work to share stories of the biosphere and its scientists.
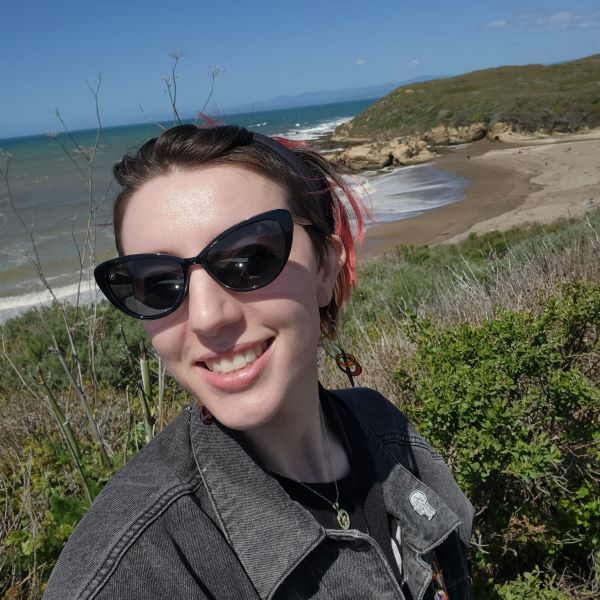
Lindsay Newey
Illustrator
B.S. (Biology) California State University, Monterey Bay, CA
Internship: Emerging Creatives of Science
My life has always been a balancing act between the love of science and the love of art. These fields have always been arbitrarily separated, but in reality they are interconnected and enhance each other. It seemed like an impossible feat until I heard about scientific illustration from my high school art teacher. It led me down my collegiate path, majoring in Biology and minoring in both film and art. I always joked I was the coolest looking one in my science classes and the only one in my art class that knew the sodium-potassium pump process by heart.
You can follow me on Instagram at @covenriot.
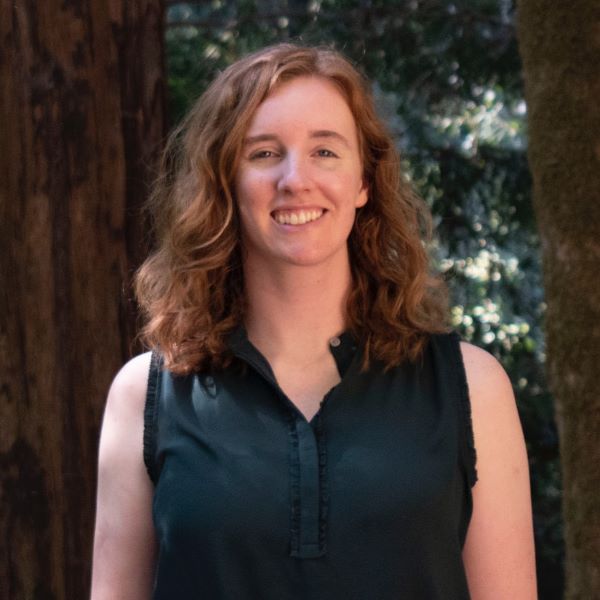
Kaelin O'Hare
Illustrator
B.A. Hons (Illustration) Norwich University of the Arts, Norwich, Norfolk, United Kingdom
Internship: California State Parks
I used to hold science at arm’s length. I thought I was doing just that when I went to university for illustration. There, I focused my practice on landscape. Site visits drew me towards natural history, and I found myself intrigued with any and all interpretive media telling the story of an environment.
For the last few years, I worked at a park, where I further reconciled my relationship with science, and had the opportunity to develop interpretive panels. This experience made me keenly aware of where my skills need development, while simultaneously strengthening my enthusiasm for the field.
My practice has landed here, at the intersection between art, science, and education, and I could not be more excited to be part of a program where I can grow my skill set.
You can follow me on Instagram at @kaelinohare_illustration.