Tracking Quicksilver
The South Bay is full of mercury. A team of scientists wants to find it. Reported by Madeline Reinsel. Illustrations by Nyssa Prowell and Christina Weatherford.
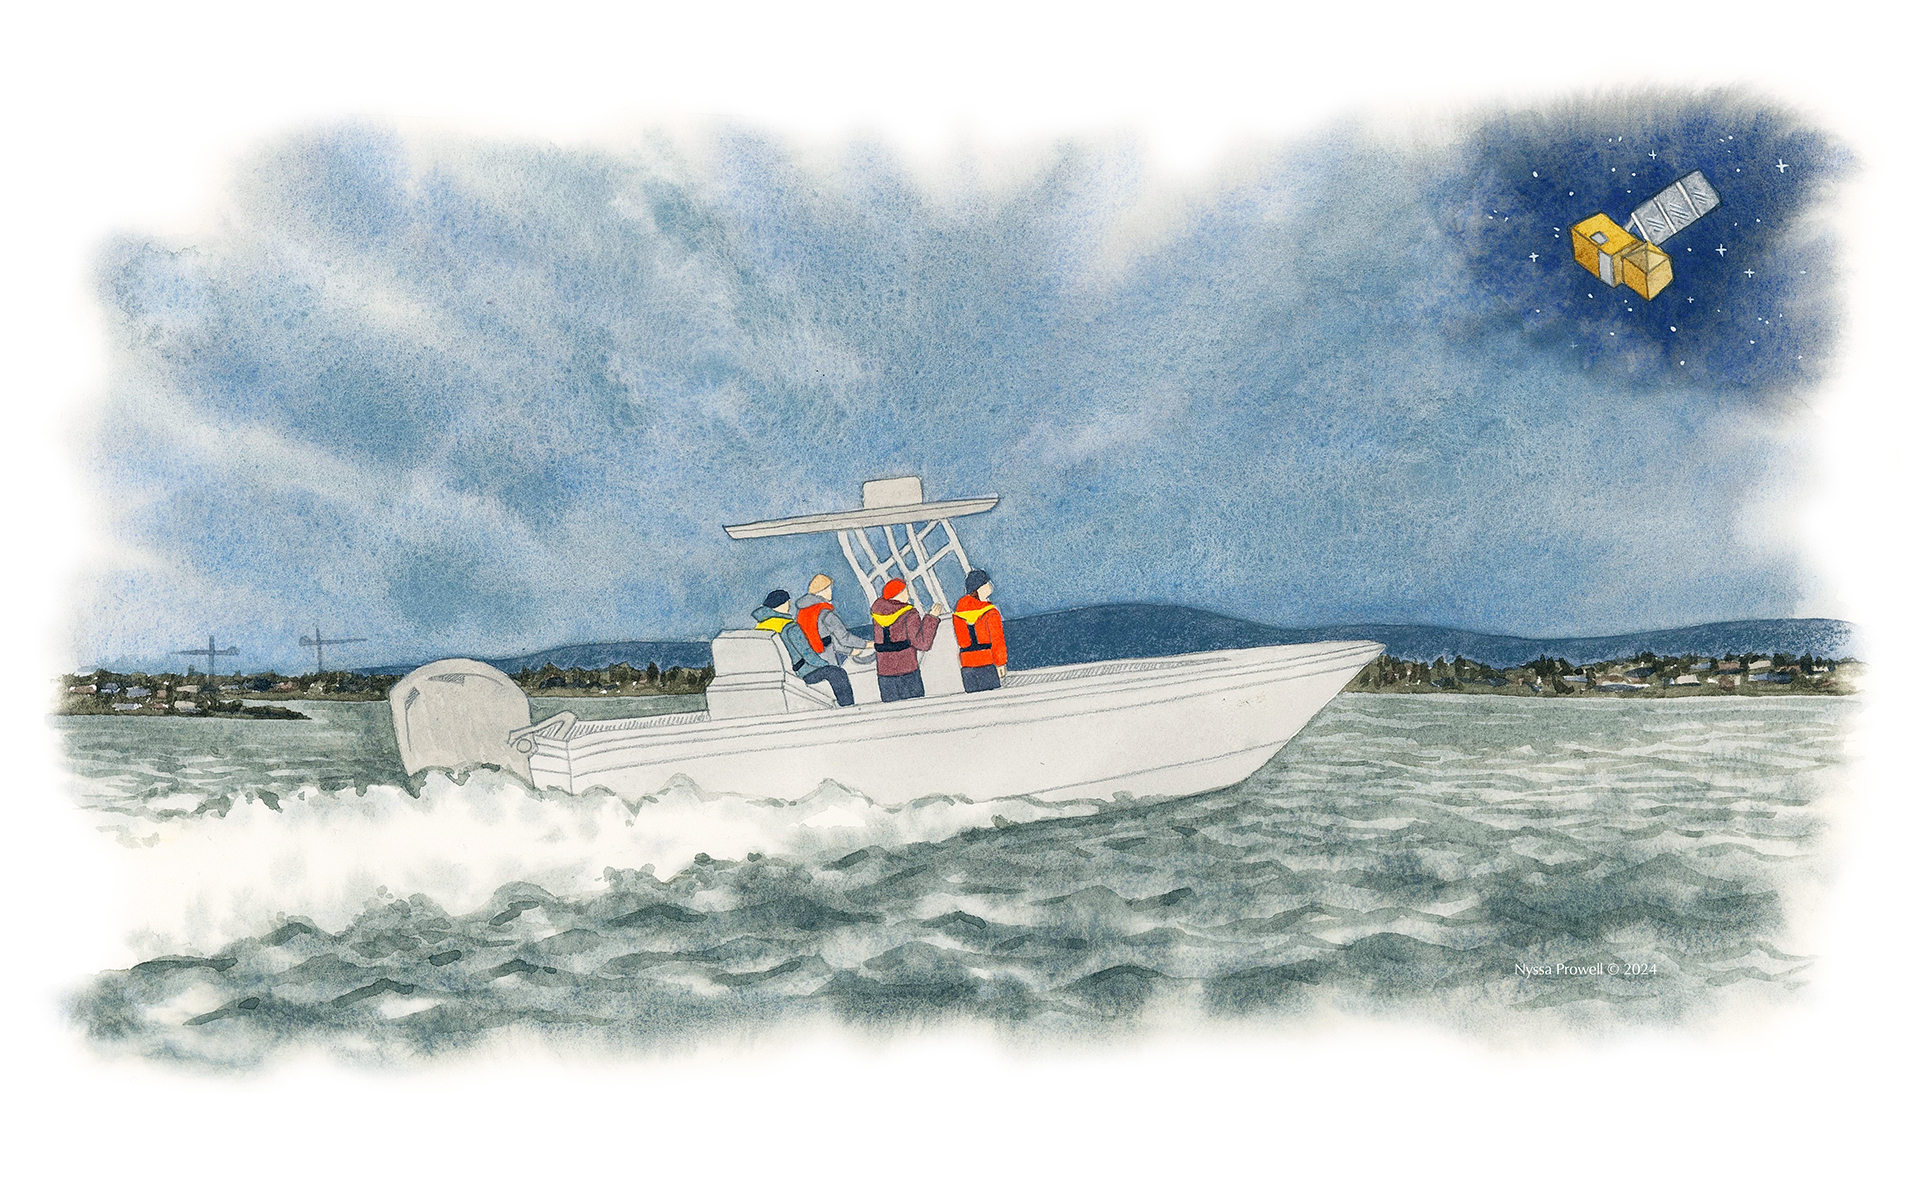
Niky Taylor, a geographer with the U.S. Geological Survey, and her colleagues have tied a boat to a marshy boardwalk near the Ravenswood Slough, about twenty-five miles south of San Francisco. Taylor is standing with a clipboard on the rolling bow of the boat, her high-vis life jacket clashing with the muted surroundings.
The sky above San Francisco Bay is a blustery gray. Rust-colored industrial sites sit next to the splashy red, yellow and blue facades of tech company campuses that dot the marshy landscape, where patchy green grasses rest on mud flats during low tide. In the distance, the San Francisco skyline shimmers through a faint fog. But Taylor is interested in the color of the water.
Measuring water color will help Taylor and her team find out just how much mercury, a dangerous neurotoxin, is in the Bay.
She’s hoping that the clouds will break before the Sentinel 2 satellite flies overhead, taking pictures of the water and land below. Then, she’ll be able to match up field measurements of water color with the satellite imagery.
But a drenching atmospheric river rolled through the Bay Area a few days before this late January 2024 field sampling trip, and the sky is still overcast at 11 a.m. When the satellite passes over, it will see only clouds.
“We’re going to call this 100 percent cloud cover,” Taylor says, before someone points out a small square of blue sky.
“Good point,” she says. “Alright, 95.”
Mercury is widespread in the water and mud of San Francisco Bay, much of it originating from mid-1800s mining operations. But not all of that mercury stays in the Bay. Some makes its way into wildlife: microbes lurking in the top layers of the mud convert mercury into methylmercury, a form of the element that can then start to travel up the food chain when tiny plankton in the water column eat those microbes. The plankton are in turn eaten by small fish, which are eaten by larger fish, which are then eaten by any number of creatures, including birds, seals and humans.
As it makes its way up the food chain, the element accumulates to higher concentrations, poisoning those who eat fish from heavily polluted waters. Humans, birds and other wildlife who ingest too much mercury can suffer from neurological problems, reproductive issues and, in rare cases, die.
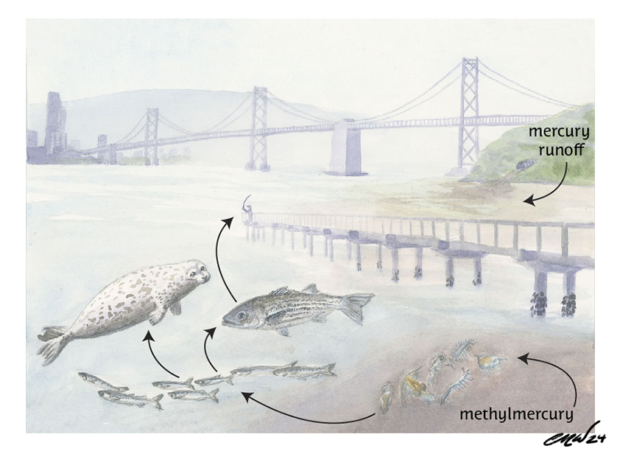
Illustration: Christina Weatherford
Now, Taylor and her colleagues from USGS are using relationships between water color and the amount of mercury in the water to model and map fluctuations of the toxic metal in San Francisco Bay. The team’s project is focused on the South Bay, loosely defined as the area of the Bay south of the Golden Gate Bridge, which collects runoff from San Jose and Silicon Valley.
The region is littered with former mercury mines, which are still leaching pollution into the environment. The Bay already has high mercury levels compared to other bodies of water, but winter downpours or changes in the landscape can cause more of the element to enter the water.
The team is docked close to where one of the nation’s largest environmental restoration projects has been underway for 20 years. In December 2023, the South Bay Salt Pond Restoration Project carefully breached a levee that separated a former salt evaporation pond from the Bay, allowing the water and sediment to freely mix. Large landscape changes like the levee breach can cause months-long “spikes” of mercury in the Bay, as mercury-laden sediment mixes with Bay water.
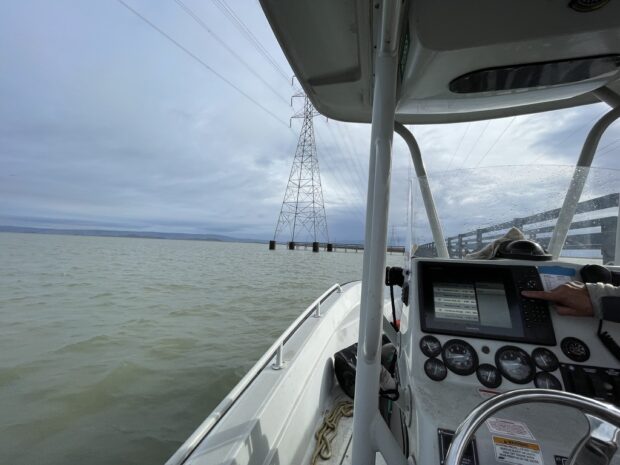
The USGS boat docked in the South Bay in January 2023. Credit: Madeline Reinsel
The USGS team can take advantage of dramatic environmental changes, like the levee breach or strong atmospheric river storms, to improve their understanding of how mercury flows into the Bay, and each data collection trip brings the team one step closer to mapping mercury in the watershed.
Achieving their goal may help fill in the gap between measurements of mercury upstream and individual samples of mercury in the Bay’s water or fish.
“It’s important to keep track of mercury in South San Francisco Bay,” says Taylor. “But there’s not really a way to map where mercury is in the water.”
The Mercury Rush
Mercury is a silvery liquid at room temperature, nicknamed “quicksilver” for its ability to move quickly across flat surfaces. Gold miners have used mercury for over 1,000 years because of its ability to bind to gold particles, and gold processing rose to industrial scales during California’s Gold Rush in the mid-1800s. Miners poured liquid mercury over rock fragments, or added it to slurries of sand and gravel, where it bound to any gold present. The miners then heated the gold-mercury amalgam, vaporizing the mercury and leaving behind pure gold. Workers who inhaled the fumes frequently suffered from neurological disorders, and mercury from these processes often escaped into the environment.
While gold processing contaminated the environment, additional mercury pollution came from the mercury mines themselves. Over 220 million pounds of mercury were released into California’s ecosystems between 1850 and 1981 as runoff or waste product, from at least 550 mercury mines and hundreds of hydraulic gold mines statewide. Much of the mercury that the USGS team is tracking began its journey to the Bay from the New Almaden Mining District, home to the oldest mercury mine in the state. Mines at New Almaden operated south of San Jose until the middle of the 20th century, although they were most productive during the Gold Rush era. Now a Santa Clara County Park, the mining district supplied $70 million of mercury from the earth to help fuel Californians’ hunger for gold. The mercury mining boom sparked by the Gold Rush generated so much wealth that it even helped dub San Jose’s newspaper The Mercury News.
Water flows downhill, and so does mercury.
Several of these former mercury mine sites, including New Idria Mine in San Benito County, Mount Diablo Mine in Contra Costa County and Sulphur Bank Mercury Mine in Lake County, are now some of the country’s most toxic so-called “Superfund” sites, all in various states of cleanup. Many additional, smaller mines litter the Bay Area. But cleaning up those mines can be a daunting, expensive process, and those responsible for the original pollution are often long gone.
Water flows downhill, and so does mercury. Mercury from both gold and mercury mines washed into the region’s small creeks, tributaries and larger rivers. And, eventually, those rivers deposited the contamination into the Bay.
Mercury’s Dangerous Impacts
Historic mines aren’t the Bay’s only source of mercury – modern industrial processes and contaminated rain also add mercury to the watershed, though on a smaller scale. Regardless of the source, high levels of environmental mercury can have dire consequences for humans and wildlife.
Fish with high levels of methylmercury can develop gill inflammation, reproductive issues and loss of other basic functions. At high enough concentrations, they can die from the exposure. Scientists have also found that many species of birds in the South Bay have high levels of methylmercury in both their eggs and in blood samples. The eggs of fish-eating birds, including kingfishers, the California least tern and the California clapper rail may fail to hatch if the birds are exposed to high amounts of mercury, imperiling the species.
In humans, sport fishers who consume fish face the highest risk. Mercury does not easily break down, and it can’t be cooked away. The California Office of Environmental Health Hazard Assessment publishes fish consumption advisories for the Bay and its tributaries, based on mercury and other contaminants. The risks are especially high for children and pregnant women, but it can be difficult to know if people comply with the advisories, especially among diverse and immigrant communities. A study conducted in the Sacramento-San Joaquin Delta region of the Bay, for instance, found that consumption of sport fish was much higher among Hmong and Cambodian women than in the general population.
“Who is it that’s eating fish out of the Bay because they’re hungry, or because they have a cultural tradition around doing so?” says Allison Luengen, an associate professor of environmental science at the University of San Francisco. “It’s disadvantaged groups that are disproportionately affected, probably, by this problem.”
Mercury contamination has also changed the diets of indigenous Californians, especially since the mid-twentieth century.
“It’s hard to gauge how it affected us. But certainly we’re aware of it now, especially with the gathering of seafood,” says Gregg Castro, the culture director of the Association of Ramaytush Ohlone. “In some of those species, they particularly collect and hold on to mercury – abalone is a big one, especially on the coast.”
Down By the Bay, Where the Mercury Goes
The team’s research is based on relationships between the Bay’s murky colors, mercury, small particles floating in the water and organic material that has dissolved into the water column.
“I like to tell people that I’ve made a career out of thinking about how brown water is,” says Taylor.
She describes the dissolved organic material as “essentially like the tea that’s in San Francisco Bay”, and the small particles as coffee further muddying the water.
“If you have water and you add tea, it darkens the water,” says Taylor. “If you have water and you add coffee, it darkens the water even more.”
The dissolved organic material and the small particles correlate with mercury and methylmercury levels – more particles and dissolved material in the water match up with changes in the Bay’s color, and higher mercury levels.
When the Sentinel 2 satellite passes over the Bay on a clear day, it takes a full-color image of the water beneath it. The USGS group times its sampling trips around the passage of the satellite, hoping to later match up their field measurements of water color with images from above. Typically, the researchers also collect water color measurements with a camcorder-like device called a radiometer, which they can later match up to the satellite images, in addition to basic water quality measurements and water samples that they’ll later analyze for dissolved organic matter and suspended sediments – the “tea” and “coffee” of the Bay – as well as mercury and methylmercury.
When the weather cooperates and the team can connect all three data sources – water color observed by boat, satellite-detected water color and in-water mercury levels – the researchers can begin to establish relationships that they will eventually use to develop algorithms and estimate mercury concentrations from satellite photos alone.
“In the end, we’ll bring them together and say, this satellite sees this much brown in the water, which relates to this much dirt in the water, which relates to this much particulate mercury in the water,” says Taylor.
Establishing those relationships will help create an easier way to monitor mercury concentrations in the Bay. Currently, mercury levels in the Bay are tracked through individual water samples or fish samples, which are difficult and expensive to collect.
“There are several steps between ‘the mercury went into the Bay’ and ‘the mercury is in the fish’,” says Allison Luengen. “Elucidating that space in between is really important.”
There’s Something in the Salt Ponds
San Francisco Bay is salty – salty enough to supply 500,000 tons of sea salt for harvest each year. The salt is harvested by evaporating Bay water from enclosed ponds, leaving behind salt that is later collected. However, the evaporation process also leaves behind high levels of mercury and other contaminants that were originally present in the water.
In 2003, state agencies, federal agencies and private companies formed the South Bay Salt Pond Restoration Project and acquired 15,000 acres of former salt production ponds from Cargill, Inc., with the aim of restoring most of the evaporation ponds to healthy estuarine habitats or ponds for wildlife.
Today, the researchers have boated to this remote boardwalk not because of what might be in the Bay, but for what might come out of the marsh. They’re close to where a salt pond levee near Ravenswood Slough was carefully breached in December 2023, after years of diligent monitoring by USGS and others. Although their goal is to be able to generate maps of mercury and methylmercury plumes after any atypical event in the South Bay, which could include large storms and levee breaches, today’s data collection will help them calibrate their model and provide valuable information about the salt pond restoration.
Jacob Fleck, a USGS research hydrologist, is leaning out of the side of the boat, attempting to haul a slimy, algae-covered metal cage out of the water. It houses a submersible fluorometer, which contains data on the color of the water, taken every fifteen minutes for the past two months. Together with water samples that the team will take later in the day, the USGS researchers should be able to create a time series of mercury flowing past this point since the salt pond breach.
“We have no idea whether this small restoration over here may have Bay-wide impacts,” says Fleck, who has joined the project’s principal investigator, Kristin Byrd, and USGS boat captain and biologist Francis Parchaso for this data collection trip during a stormy week in late January.
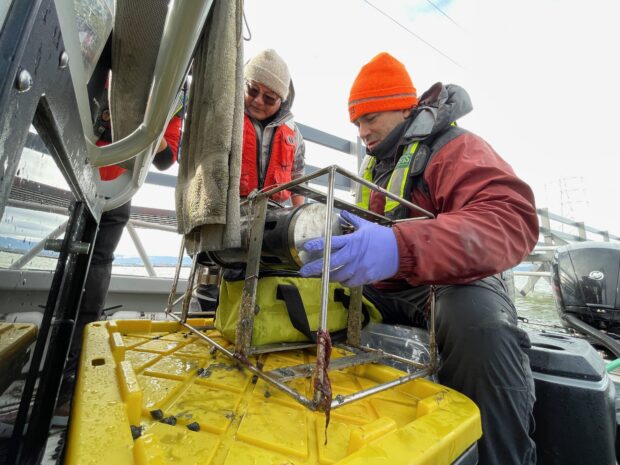
Francis Parchaso and Jacob Fleck free the fluorometer, which measures water color, from its cage. Credit: Madeline Reinsel
The USGS team does not normally collect this kind of continuous, in-water data on water color. But it comes in handy on days like this, when the satellite’s view is obscured by clouds.
Because of high levels of mercury in the salt pond mud, breaking down the artificial ponds has been a tricky process. Hoping to avoid large spikes in mercury and other contaminants entering the Bay, the restoration project has spent years studying the flow of contaminants in and out of the ponds. They also conducted numerous studies on the effects of mercury on fish, birds and other wildlife that live in and around the ponds.
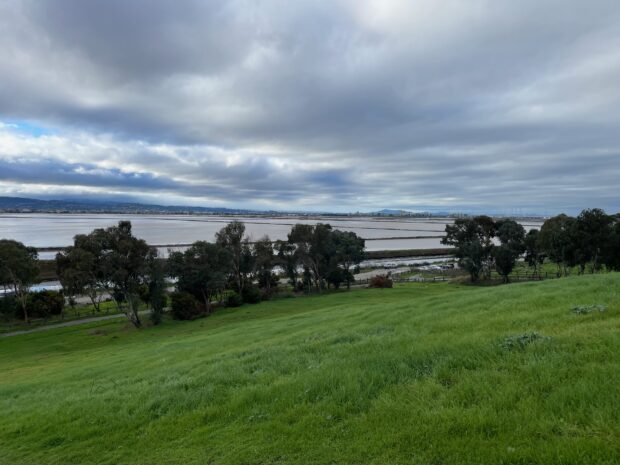
Salt ponds in the South Bay, taken from Bedwell Bayfront Park. Credit: Madeline Reinsel
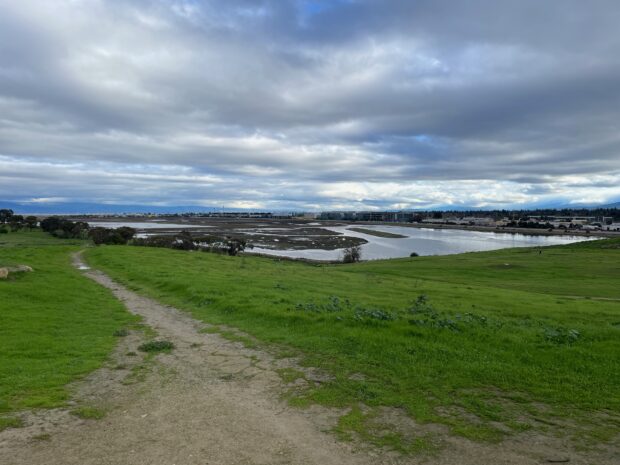
Restored wetlands in the South Bay, taken from Bedwell Bayfront Park. Credit: Madeline Reinsel
While many contaminated site cleanups involve trucking away contaminated sediment, the restoration project has chosen to let the mercury-laden sediment be buried in the marsh, where it should remain stable. However, this can make breaking down the salt ponds more difficult.
“When we do earthwork like breaching the levee, there is a little spike in mercury,” says Dave Halsing, executive project manager of the South Bay Salt Pond Restoration Project, describing past levee breaches in other South Bay salt ponds. “But it was not a terrible spike, and it returned very quickly to ambient conditions.”
Waiting for the Tide
Back on the boat, Jacob Fleck unwraps an energy bar. He and Niky Taylor are waiting for the tide to go out. They plan to collect three water samples as the tide ebbs out of the restored salt pond near Ravenswood Slough, potentially bringing spikes of mercury with it.
Finally, they’re ready to collect samples. Fleck calls out water quality measurements from a handheld instrument that he’s submerged in the murky water. He and Taylor then carefully scoop a large water-bottle sized container of water out of the Bay to take back to the lab for testing.
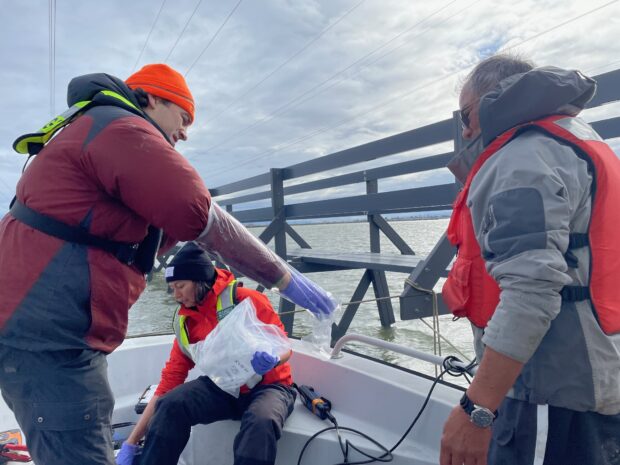
Jacob Fleck, Niky Taylor and Francis Parchaso collect water quality data from the South Bay. Credit: Madeline Reinsel
The team based this project on a USGS initiative recently completed in the Sacramento-San Joaquin Delta, a large area encompassing streams and rivers to the east of the Bay. That project was led by Fleck and Mark Marvin-DiPasquale, a USGS research microbiologist who has worked extensively on issues related to mercury pollution in and around the Bay. The Delta has many of the same mercury troubles as the South Bay and, taken together, the two completed projects could provide a good picture of mercury levels in large portions of the Bay.
“We’re trying to estimate mercury concentrations at places and times when we’re not there collecting a sample,” says Marvin-DiPasquale. “That’s the game.”
Learning to Live with Mercury
The USGS team doesn’t expect its research to spur immediate action. But as California’s weather grows more extreme and the Bay’s landscape continues to change, its maps could help the region better understand patterns of mercury across the Bay. And though regulators are aware of the dangers of pollutants like mercury, the problem doesn’t appear to be going away anytime soon.
The USGS team began field sampling for this project in August 2022, right before early 2023 brought historic rains to the area. Climate change has increased the number of intense rain events throughout the state, which means more water, sediment and mercury washed into the Bay.
The California State Water Resources Control Board sets limits on how much mercury can flow through rivers and streams around the Bay, and in the Bay itself. But those limits can be hard to meet: the agency put mercury limits for San Francisco Bay into place over fifteen years ago, and the watershed still isn’t meeting targets.
“Over the last thirty years, there have not been changes in fish mercury concentrations in the Bay,” says Gerardo Martinez, a water resources control engineer at the Water Board. “So that will lead us to essentially say there hasn’t really been a reduction in mercury concentrations.”
Modeling and mapping mercury in the Bay could eventually give regulators and scientists another tool to track the toxic metal as it enters and moves throughout the South Bay. Marvin-DiPasquale sees the model being used for applications such as estimating mercury flow into and out of salt ponds, estimating mercury flux after big storm events or even tracking how ratios of the many forms of mercury change with the seasons.
While the USGS researchers did see more suspended sediment flow into the Bay during 2023’s atmospheric rivers, they won’t be able to analyze those images for mercury until they have finalized their model.
But when they do, they’ll be able to detect mercury in both future and past events, a method known as ‘hindcasting’. Taylor has already taken a peek at the satellite images from 2023’s storms.
“It’s just been really interesting to live through what felt like some really catastrophic events,” she says. “And then be able to look back and see the impact that they all had on the Bay.”
After being docked for almost four hours, the team stows its gear and instruments, readying for the bumpy ride back to Redwood City. On the way back, the boat stops to collect one more water sample, then turns to head back to shore.
The researchers plan to keep collecting field samples through the end of the summer, which will hopefully allow them to capture more large storm events. Then, they’ll get down to the hard work of creating their model.
“We just want to have a tool for anybody to use,” says Marvin-DiPasquale. “To observe these changes in the past, and going forward.”
© 2024 Madeline Reinsel / UC Santa Cruz Science Communication Program

Madeline Reinsel
Author
B.S. (environmental sciences) University of Virginia
Internships: Santa Cruz Sentinel, Stanford News, Science Magazine
A few years after college, I found myself in many ecologists’ literal dream job: working in the field on turtle conservation research. While I loved my job, I wanted to document and write about our work more than I wanted to run statistical analyses on our datasets. That interest led me to complete several communications projects for the university department where I worked, including multimedia projects and a short documentary. In the meantime, I began to work on communicating other scientific research happening at our university: while turtle conservation topics are best communicated visually (who doesn’t want to see photos of turtles?), other stories were better expressed through written articles. I found that sharing stories about science filled an important gap, no matter the communication medium, and was appreciated by scientists and readers alike.
Christina Weatherford
Illustrator
My fieldwork experiences have given me the unique privilege of witnessing firsthand the incredible diversity of life and resources that we share our planet with. However, these experiences have also made me acutely aware of the threats they face—habitat degradation, invasive species, pollution, and climate change, to name a few. I feel incredibly fortunate to have seen what I have, knowing that many people do not have the same opportunity. Through my illustrations, which are deeply influenced by my relationship with these creatures and places, I hope to inspire others to explore the world around them and foster their own connections with the ecosystems they are a part of.
Nyssa Prowell
Illustrator
B.S. (natural resources) Oregon State University
Internship: City of Moscow Water Building Mural with Jay Rasgorshek
Growing up in the unique and beautiful landscape that is the Pacific Northwest, I found it instinctive to connect with the wild places right outside my door. Over the past decade I have mainly worked and studied in the natural resources field, exploring many ecosystems across the west. This path led me to clearing trails in the Montana backcountry, restoring riparian areas in Washington, and pursuing science undergraduate studies in Oregon. Alongside these pursuits, I have always explored my creativity, which is often fueled by what I experienced outside. The pull to create art from what I see and feel outside has been a constant in my life, and it’s how I relate to the places around me. My goal as an artist is to bring others into that same space of curiosity, admiration, and connection with the natural world.