How to listen to black holes, touch stellar deathbeds and see the universe without sight
Non-visual astronomy reveals the universe to blind and low-vision audiences, Isabel Swafford reports. Illustrations by Rowan Weir and Adara Koivula.
Look up at the night sky and then close your eyes. The twinkling stars and distant worlds disappear.
Now imagine you hear a repeating piano note. Rhythmic and regular, it tolls like a bell.
A new note interrupts the drone, adding itself to the noise. Higher in pitch, it comes in at a slightly faster tempo. A few beats later more notes chime in, each getting higher in pitch and speed. Finally, the last note arrives as staccato pings, beeping like a metal detector over hidden treasure.
The maestros of this cacophony are the TRAPPIST-1 exoplanets, a system of alien planets outside of our solar system, orbiting their star 40 lightyears away from us.
The beeps and boops of TRAPPIST-1 were created through data sonification, a process that mathematically translates data into sound. Scientists used the orbital periods, or years, of the exoplanets for each pitch. Lower pitches were assigned to longer orbits, and higher pitches to faster orbits. The resulting chaotic symphony is a fascinating achievement that also reveals the intriguing exoplanets to audiences who are blind or low vision, said Christine Malec, an accessibility consultant and member of the blind community.
“Sonifications were life-changing.”
“Sonifications were life-changing,” Malec said. Malec uses sonifications as a way of engaging with astronomy images, which are often inaccessible to her. “They were a visceral way for me to process some of the really abstract ideas that I had only been able to read about before that time.”
Astronomers act as cosmic translators painting pictures of distant galaxies and ominous black holes. Clouds of gas and dust come only into view through the eyes of careful readers of data and makers of code. Every day, astronomers methodically combine telescope observations from all across the light spectrum, most of which humans cannot see, to visualize the universe. The resulting images inspire millions.
But for audiences who are blind or low vision, the visual beauty of the cosmos is usually out of reach.
From early drawings to planetarium shows to 20-million-pixel images, astronomy has been built upon a visual language. Kimberly Arcand aims to speak astronomy in other languages, including sound and touch.
As a child, Arcand loved learning but was terrified to begin kindergarten. Her shyness made it difficult to make friends, but one girl, Heather, reached out to Arcand. Heather was deaf and was learning sign language with the help of a tutor.
“She taught me the alphabet and a couple of basic signs, which I still remember. She brought me into her world and included me in her ways of being. I have never forgotten that,” said Arcand. “She taught me that there’s always a way to reach out to different people to try new things.”
Now, as a visualization scientist and science communicator at NASA’s Chandra X-ray Observatory, Arcand creates sonifications, 3D prints and visual descriptions of astronomy images. Many of these techniques are not new ways of presenting data, but they are being applied and circulated in ways like never before.
Wanda Diaz-Merced, an astronomer who is blind and uses sonification in her research, said that before Arcand, no one was integrating multiple sensory methods, like sonifications, 3D prints and visual descriptions, for public outreach in astronomy.
“Her work is groundbreaking,” said Diaz-Merced. “She is a pipeline that brings more and more people to the field.”
Arcand was inspired to create sonifications of images by her now-collaborators Matt Russo and Andrew Santaguida, the creators of the TRAPPIST-1 symphony.
Russo, an astrophysicist and musician, and Santaguida, a musician, have been friends since high school and played in a band together for 15 years. Shortly after Russo completed his Ph.D., the TRAPPIST-1 system was discovered in 2017.
The planets orbit so close together that they gravitationally tug on each other as they pass by their neighbors, causing their orbits to be locked in a pattern, or resonance. The resonance is what inspired Russo and Santaguida to make music.
“The TRAPPIST-1 system is the most musical solar system ever found,” said Russo.
“We didn’t even know what sonification was at that time, but we saw that the orbits of the planets could make music,” said Santaguida.
In 2020, Arcand reached out to Russo and Santaguida to help create sonifications from data from NASA’s Chandra X-ray Observatory.
“We wanted to bring all that X-ray energy to life through sound and mathematical mapping,” said Arcand. One particular X-ray energy source, a supermassive black hole, stuck out to Arcand because it generates a repeating pattern of pressure waves.
Hundreds of millions of lightyears away, at the center of the Perseus galaxy cluster, this supermassive black hole sings out into the universe. At a frequency about 57 octaves below middle C, the cosmic diva releases waves of energy that travel through the surrounding gas just like how sound waves move through air.
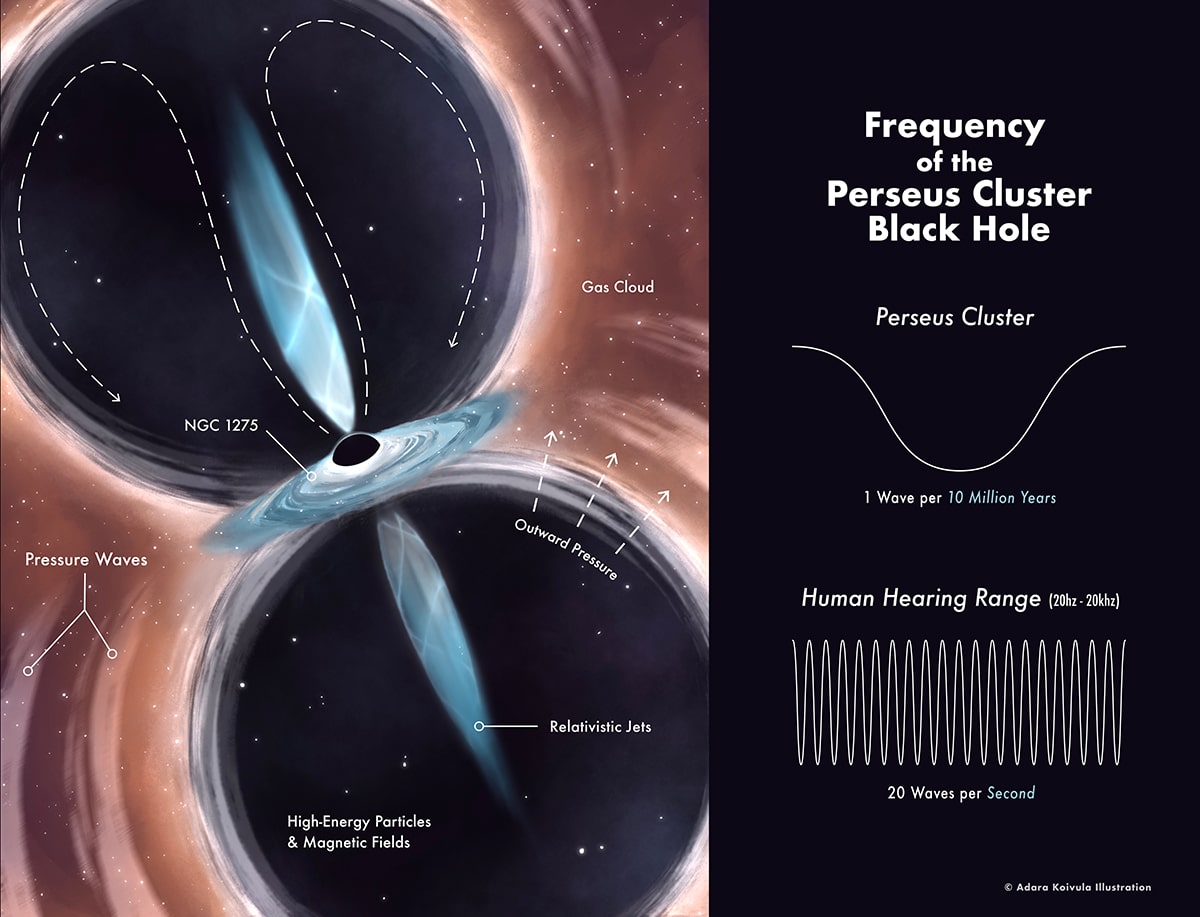
The black hole at the center of the Perseus Cluster is a frenzy of hot gas and high-energy particles. Jets of relativistic particles shoot out from the black hole at nearly the speed of light, creating giant bubbles as seen in the diagram. These bubbles create pressure waves as they are formed, which we observe as sound waves. (Credit: Adara Koivula)
Even if the black hole sang its note for us here on Earth, it would be too low for our human ears to hear. Through sonification, Arcand transposed the sound into an eerie hum to accompany an X-ray image of the black hole.
On August 21, 2022, a NASA Twitter account posted Arcand’s sonification with the caption, “The misconception that there is no sound in space originates because most space is a vacuum, providing no way for sound waves to travel. A galaxy cluster has so much gas that we’ve picked up actual sound. Here it’s amplified, and mixed with other data, to hear a black hole!”
The tweet quickly went viral, racking up 17.5 million views.
Credit: NASA Chandra X-ray Observatory
“It was the biggest public response to a project that I’ve ever witnessed in any of the work I’ve done,” said Arcand. “I was totally gobsmacked by the attention on it.”
The virality of the black hole sonification was a testament to the impact of her work and was an important step in continuing to support sonifications, Arcand said.
“It was an area of ‘play.’ We didn’t know if it would truly be valuable or not,” said Arcand.
Throughout her many endeavors in science communication and data visualization, Arcand repeatedly emphasizes the need for play. She said that playing with different techniques and methods can help you explore “different ways of knowing.”
Arcand, Russo and Santaguida have now contributed to the sonifications of the first images released by NASA’s newest telescope, JWST, while other scientists are also creating sonifications of data from the Hubble Space Telescope. Sonifications are also gaining popularity in other fields like geology, physics, climate change and oceanography.
“Once I heard my first sonification, I was completely hooked on the idea of turning data into sound,” said Malec.
Malec offers her experience as a person who is blind to help Arcand make astronomy accessible to people who are blind or low vision. They have been collaborating since 2020. Arcand cites the idea of accessibility as “making with, not for,” and really values working with members of her target audiences.
“She’s genuinely committed to inclusion,” said Malec.
Touching stellar deathbeds
In another example of “making with, not for,” Arcand began a partnership in 2017 with the National Federation of the Blind to produce 3D prints of astronomical objects to enrich learning for visually impaired and sighted audiences.
Conveying information in three dimensions has long been a vital way to communicate with audiences who are blind or low vision, like reading braille for example. But for most astronomy books, the communication stopped at Braille text, with no images to be found.
For Noreen Grice, an accessibility advocate and astronomy educator, this had to change.
In 1984, Grice was working at the Museum of Science in Boston as a planetarium show director in between classes at Boston University. One day, a group of blind students came into the planetarium. Curious to see what their experience was like, she asked the students what they thought of the show.
“They said it stunk. They didn’t like the show. They walked away, and I felt horrible. I felt like someone had just thrown a brick at me,” said Grice. “If I hadn’t been working that day, it would have never occurred to me that the planetarium was not accessible.”
In collaboration with scientists and NASA astronomers, Grice has written and developed numerous books and tactile images for the blind and low-vision community. Books like “Touch the Stars” and “Touch the Universe” include embossed images of planets, constellations and galaxies which allow readers to feel an image with their fingers. Different textures represent different elements of an image, like dots for stars and lines for constellations.
With this experience in creating tactile astronomy images, Grice and Arcand worked together on designing 3D prints of nebulae and supernovae.

Left: Kimberly Arcand sits with some of the 3D prints her team has created. (Credit: Brittanny Taylor) Right: This person is holding a 3D printed model of the Cassiopeia A supernova remnant. (Credit: NASA)
Big stars don’t simply die; they go supernova. A supernova occurs at the end of the life of a massive star or a white dwarf. For a typical supernova, when a star’s core collapses, the explosive process can be triggered in less than a quarter of a second.
Within seconds, the explosion travels from the center of the star to its surface, popping open the star itself. This shock wave can reach speeds anywhere from 5,000 to 20,000 kilometers per second, or around 10 to 40 million miles per hour.
The explosions look like lumpy bubbles, with various protrusions and dimples pockmarking the outer shell. Inner layers present themselves as different colors in astronomy images, denoting different matter throughout the remnant of the supernova.
For Supernova 1006, or SN 1006 as pictured here, the red-colored gas is red hot at millions of degrees. The blue wispy shell is made up of high-energy particles like electrons.
As a 3D print, this stellar deathbed was chopped in half and peeled back like an onion. The inner layer is a messy conglomerate of little stone-like spheres connected by short pillars and small pockets. This smushed-together ball of bubbles fits like a puzzle piece into the outer shell, which represents the high-energy particles that surround the hot gas. The shell is smooth on the outside and dimpled on the inside to match the inner component.
Arcand has created these 3D models of celestial objects with scientists at NASA’s Chandra X-ray Observatory. With the scientists’ expertise, the models are both accurate and appropriate for outreach applications.
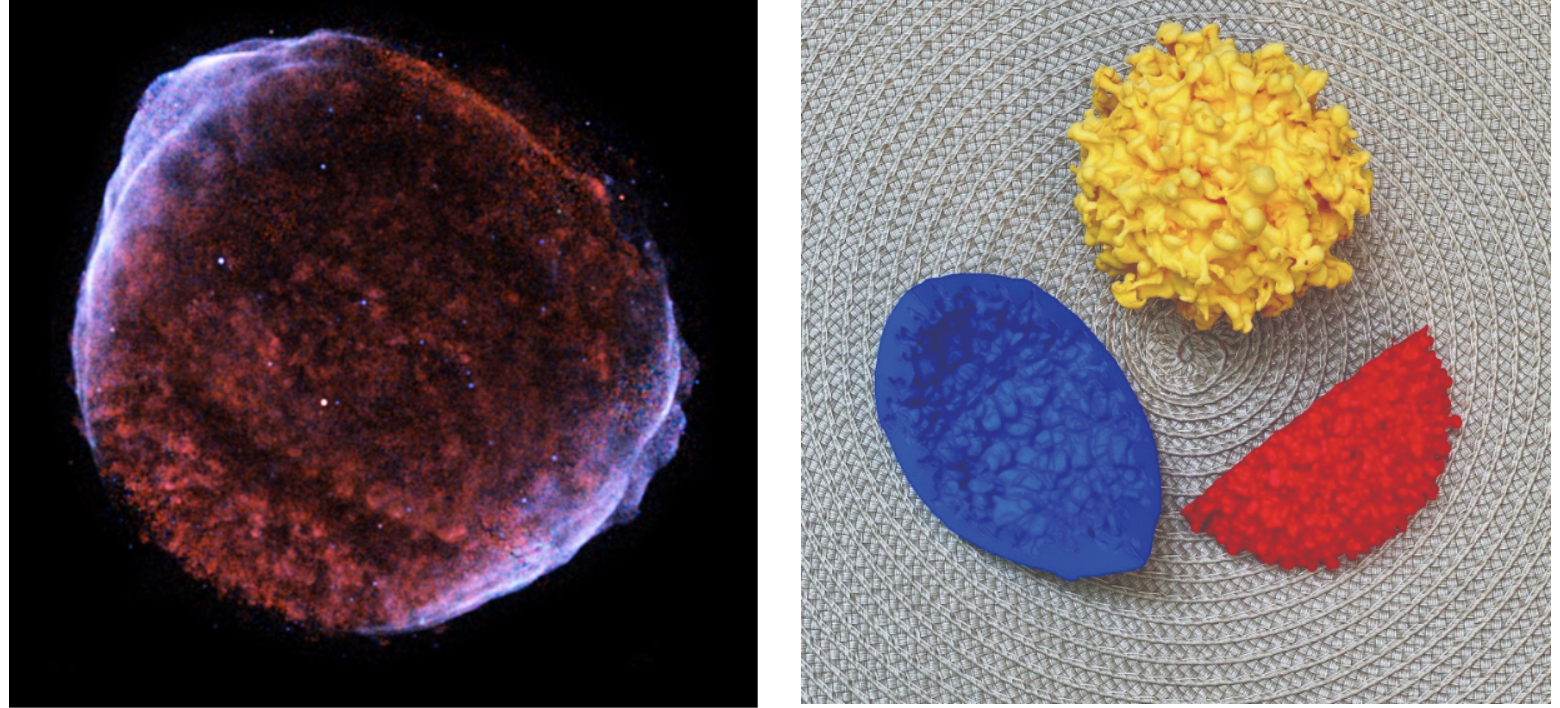
Left: An image of Supernova 1006 taken by NASA’s Chandra X-ray Observatory. (Credit: NASA) Right: The 3D printed model of SN 1006, with the outer and inner shells separated. (Credit: NASA)
In 2017, Arcand’s team brought their prints to a group of students with the National Federation of the Blind to get their feedback. As each student felt through the models, Arcand was intrigued by their unique perceptions of the prints.
“They were creating these incredible mental maps inside their head as they were exploring tactically through the object. It absolutely blew my mind,” said Arcand.
The workshops helped the team figure out that things like print quality and texture were very important as someone explored the objects. The students also asked to feel the inside of the 3D prints, wanting to understand the full tactile shape of the objects. This led Arcand to create prints that could be cut in half, revealing their inner structure.
This phenomenon of creating experiential mental maps turns out to be a common way that people in the blind and low-vision community interpret the world. When a person cannot rely solely on vision, our other senses like sound and touch, and our presence in our own body, become the primary ways to probe one’s surroundings.
“When I have a three-dimensional representation of a familiar space in my mind, I associate my body being in that space,” said Malec.
Malec says that engaging with these accessible astronomy materials is like remembering the route to her local bus stop or the path she takes through the grocery store.
Seeing the universe without sight
Another avenue of accessibility that Arcand’s team explores is that of visual descriptions of images. On the web, alt text, or alternative text, describes the appearance or function of an image on a page. A visual description, like alt text, conveys the main elements of an image or other visual medium through written words, but does so in much more detailed way. These words get read aloud by a tool called a screen reader. For instance, a visual description could state that a picture depicts ‘a woman walking her dog on a suburban sidewalk,’ with more details about the clothes she wears or the dog she is walking. But for astronomy images of bizarre and unfamiliar marvels, visual descriptions are much more complicated than sidewalk scenes.
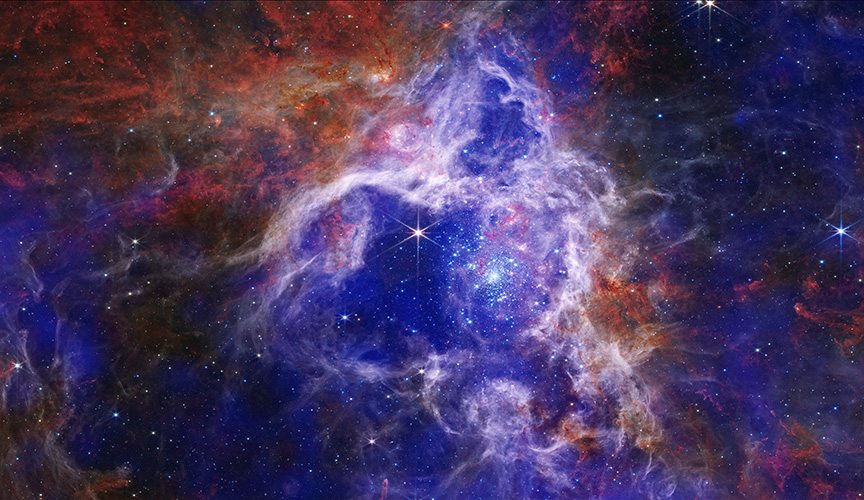
Arcand’s Zoom background, for instance, shows a stellar nursery, or nebula, called 30 Doradus, better known as the Tarantula Nebula, spread out in a web of wispy dust and sparkling stars behind her head.
The nebula hosts entire lifecycles of stars, from newly-fired baby stars to the shell-like corpses of exploded stars. Within the nebula, gas and dust begin their long gravitational journeys as they compact and form protostars, or baby stars, right alongside their ancestors’ remains, which sow the seeds for new stars to form. Supernovae light up the blue and purple cloud with the energy of 10 billion suns, making it possible for astronomers to observe it from thousands of lightyears away.
These are the scenes Arcand transposes to spoken words.
Visual Description: This release features a composite image of 30 Doradus, otherwise known as the Tarantula Nebula, a region of active star formation in a neighboring galaxy. In the image, royal blue and purple gas clouds interact with red and orange gas clouds. Specks of light and large gleaming stars peek through the colorful clouds. The patches of royal blue and purple gas clouds represent X-ray data collected by the Chandra Observatory. The brightest and most prominent blue cloud appears at the center of the image, roughly shaped like an upward pointing triangle. Darker X-ray clouds can be found near the right and left edges of the image. The red and orange gas clouds represent infrared data from JWST. These patches resemble clouds of roiling fire. The brightest and most prominent infrared cloud appears at our upper left, roughly shaped like a downward pointing triangle. Wispy white clouds outline the upward pointing bright blue triangle in the center of the image. Inside this frame is a brilliant gleaming star with six long, thin, diffraction spikes. Beside it is a cluster of smaller bright specks showing young stars in the nebula. (Credit: NASA)
“One common request from people who are non-experts is that it’d be great to have an astronomer sitting next to them being able to point out what is important in an image,” said Arcand. “It’s like you have the curator at a museum sitting next to you, helping you navigate through Van Gogh’s ‘Starry Night.’”
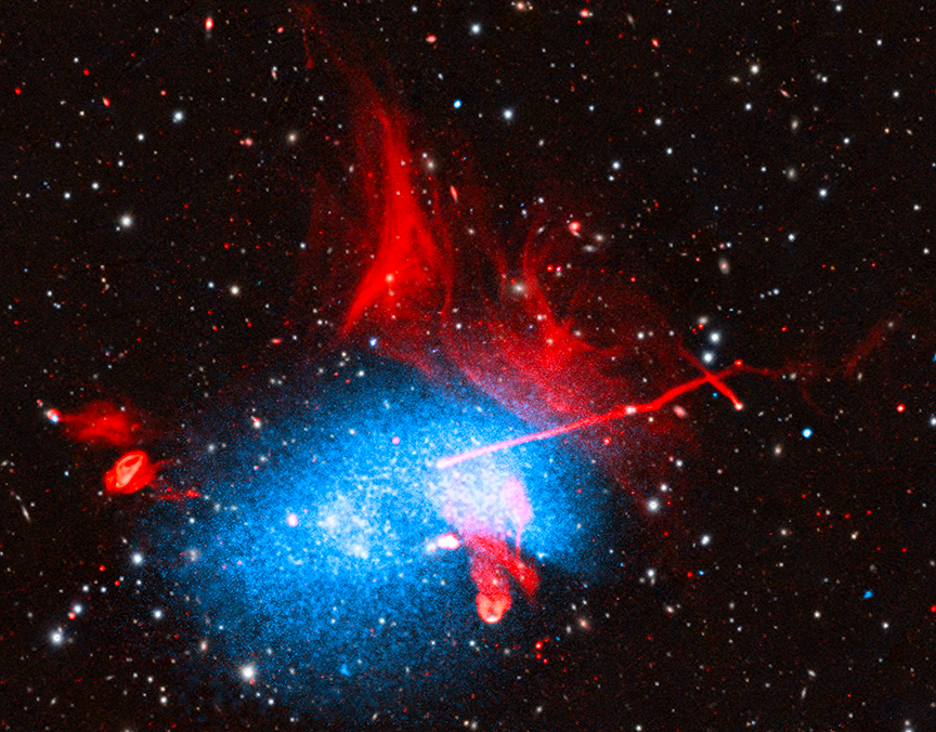
Visual descriptions have the unique opportunity to weave in scientific knowledge within the fabric of an image. When a non-expert looks at an image of Abell 2256, three galaxy clusters in the midst of a cosmic car crash, they might see a glittering blue blob surrounded by red flares. But when Arcand sees this image, she sees a “cosmic narwhal” with flaming red hair. The blue body is made up of hot gas and the red hair and horn are particle jets piercing through space.
“It’s like you’re braiding hair, and you’re pulling in each of those strands. The science, the description and the visual elements are all really important pieces of creating a nice braid,” said Arcand.
Her team’s visual description begins:
“The resulting giant galaxy cluster, known as Abell 2256, resembles a grainy, pixilated, sky-blue cloud topped with licks of flaming red hair. The cloud is adorned with red shapes and streaks and set against a black background heavily dotted with colorful specks. The image combines X-ray, radio, optical and infrared data.”
“You can enjoy creating and reading these. They are meant to be descriptive in a very interesting way. It has been a surprise how much fun it is to work on them and see how other people respond to them,” said Arcand.
The visual description of Abell 2256 goes on to explain the image spatially, with locations of visual features relative to one another. Each color and shape is described and its science is revealed. The description guides the audience along a pathway through the image, an invaluable concept in visual description.
“With a more complicated piece where you’re talking about jets and gas clouds and galaxy clusters, if you don’t lead from one idea or one physically visible element to the next in a way that is that has some sort of internal logic, the end user is gone. They’re just completely lost, and they can’t follow it,” said J.J. Hunt, a professional describer and collaborator with Arcand.
J.J. Hunt and Christine Malec are the hosts of a podcast called “Talk Description To Me,” where they discuss current events as Hunt describes the visual elements.
In an episode from July 2020, the pair discussed the SpaceX launch of Crew Dragon Demo-2 on May 30, 2020. Listening to this episode inspired Arcand to pursue another area of play; visual descriptions.
“This was the last piece of the puzzle for me,” said Arcand. “J.J. and Christine have a fantastic partnership. They are able to get at the heart of the subject matter but describe it in a poetic way.”
Since 2021, Hunt, Malec and Arcand have included visual descriptions for all images released by NASA’s Chandra X-ray Observatory.
“It’s a real-time response to something that’s going out right now, versus having to create a sonification or 3D print weeks, months or sometimes years after the fact,” said Arcand.
Similar to the response towards the sonifications, visual descriptions are now catching on at other institutions, with JWST now releasing descriptions alongside their images. One particular description, of JWST’s view of the Carina Nebula, dubbed the “Cosmic Cliffs,” received its own viral moment in July 2022.
🌟 A star is born!
Behind the curtain of dust and gas in these “Cosmic Cliffs” are previously hidden baby stars, now uncovered by Webb. We know — this is a show-stopper. Just take a second to admire the Carina Nebula in all its glory: https://t.co/tlougFWg8B #UnfoldTheUniverse pic.twitter.com/OiIW2gRnYI
— NASA Webb Telescope (@NASAWebb) July 12, 2022
“In my 20-plus years of description, I don’t think I’ve ever seen the Washington Post write an article about an alt text before. It was stunning,” said Hunt.
Arcand says visual descriptions don’t always have to be big endeavors, and she encourages them not to be.
“If you can take two minutes to just describe a little bit of color, a little bit of texture and a little bit of what’s happening, you are already miles beyond ‘this is a galaxy cluster,’” said Arcand. “The smallest amount of effort can really pay off in big ways.”
Accessible materials can be used at every step in the scientific process from analyzing data to presenting at conferences, and a sonification or visual description can be a game changer for a colleague who is blind or low-vision.
“We live in a time when it’s mandatory to include other sensorial modalities in data analysis,” said Diaz-Merced, another expert in the field of sonifications.
As for Arcand’s future in accessibility, there are many more cosmic narwhals and singing black holes to be shared with new audiences.
“She’s an incredible dynamo with such energy and openness—a real advocate,” said Hunt. “These kinds of projects only happen when there’s someone who truly believes in it.”
© 2023 Isabel Swafford / UC Santa Cruz Science Communication Program
A version of this piece originally ran in the March 2024 issue of Sky & Telescope.
Isabel Swafford
Author
Internships: Stanford Linear Accelerator Center, Lookout Santa Cruz, Caltech IPAC, NASA Ames Research Center
As a kid, I was dead set on becoming an astronaut. I went to space camp, idolized Sally Ride, and consumed all of the space-related content that I could put my tiny hands on. I spent my entire childhood consuming National Geographic magazines, PBS specials, and NPR segments, my gaze set permanently on the stars.
At Caltech, I studied astrophysics and English. I was enamored with the universe and the myriad ways we can observe its complexities, but I also loved literature, poetry and writing. Seeking ways to merge these two passions of mine, I dove into science communication.
Through writing, video and social media, I want to share the stories of the universe and the people who study it.
Rowan Weir
Illustrator
Internship: Yuba Water Agency (Marysville, California)
Throughout much of human history there has been no strong delineation between science and art, as both represent creative modes of exploring the natural world and our tenuous place within it. Although modern consensus typically presents these fields as diametrically opposed, my undergraduate work demonstrated to me the inexorable links they ultimately share. I am most frequently drawn towards topics indicative of this, such as visual perception, color theory, and pattern formation. Through this program I hope to continue engaging with what are fundamentally parallel facets of the human experience.
Adara Koivula
Illustrator
Internship: Monterey Peninsula Regional Park District (Carmel-By-The-Sea, California)
Art has always been a part of me. I can’t remember how old I was when I first put paint to paper. When I drew, I felt focused. There was a clear path for me to follow and get better at my craft. But when it came to science, I wanted to know about everything. There were too many possibilities to settle on only one field of interest. I thought that this choice was a fork in the road and I had to choose one or the other. But of course I couldn’t shake who I am at my core, and like every science illustrator, I found a way to blend. If I am curious about something, I will dig in and find the answer. What the heck is amorphous ice? Can it rain frogs? Does my dog love me? Like the answer to most questions, it’s complicated, but I can make it a little less so by using my natural inclination for art to tell these stories.
